Grid
BeamOptics traces one beamlet, in 2D: a round aperture in cylindrical
geometry, where each trajectory stands for a ring, or a slit in planar geometry. The
beamline needs the whole beam in 3D. beamlet_markers turns the beamlet’s crossings of
its exit plane into 3D markers (each ring copied at random azimuths), and
ApertureGrid copies them to every aperture of the grid, aimed by the grid’s curvature
and by steering.
The beamlet is the coarse H beamlet of the tutorial on its optimisation, at 8 kV extraction and 20 kV in total.
import numpy as npimport plasma_plots as ppimport xarray as xr
from beamtracer.beamline import ApertureGrid, beamlet_markers, gaussian_beamfrom beamtracer.optimization.beamlet import COARSE, NegativeIonBeamlet
case = NegativeIonBeamlet(**COARSE)model = case.solve({"extraction_voltage": 8e3, "eg_radius": 3e-3, "gap": 4e-3})hits = model.plane(case.exit_plane)h_minus = model.species_names.index("H-")beamlet = beamlet_markers(    hits,    mass=model.species_mass[h_minus],    cylindrical=True,    species=h_minus,    copies=200,    charge=1.0,)moments = model.beam_moments(case.exit_plane, "H-")slope = beamlet.velocity[1] / beamlet.velocity[0]print(    f"{len(beamlet)} markers, {beamlet.total_power:.1f} W, "    f"rms angle (BeamOptics) {moments.rms_angle * 1e3:.1f} mrad, "    f"(markers, in y) {np.sqrt(np.average(slope**2, weights=beamlet.power)) * 1e3:.1f} mrad")
20000 markers, 268.9 W, rms angle (BeamOptics) 27.6 mrad, (markers, in y) 27.3 mradThe beamlet at its exit plane and 0.5 m further on: the rings of the 2D trace spread round the axis. The power-weighted rms angle of the markers in one plane () is the rms angle of the traced beamlet, whose moments project the rings on one plane the same way (up to the sampling of the azimuths).
with pp.figure(1, 2, figsize=(9, 3.8)) as fig: for k, x in enumerate((case.exit_plane, case.exit_plane + 0.5)): half = 4e-3 if k == 0 else 0.03 footprint = beamlet.drift_to(x).footprint( bins=50, extent=(-half, half, -half, half) ) footprint.plasma.plot.slice( x="y", y="z", equal_aspect=True, ax=fig[k], title=f"x = {x:.2f} m", colorbar_label="power density [W/m²]", )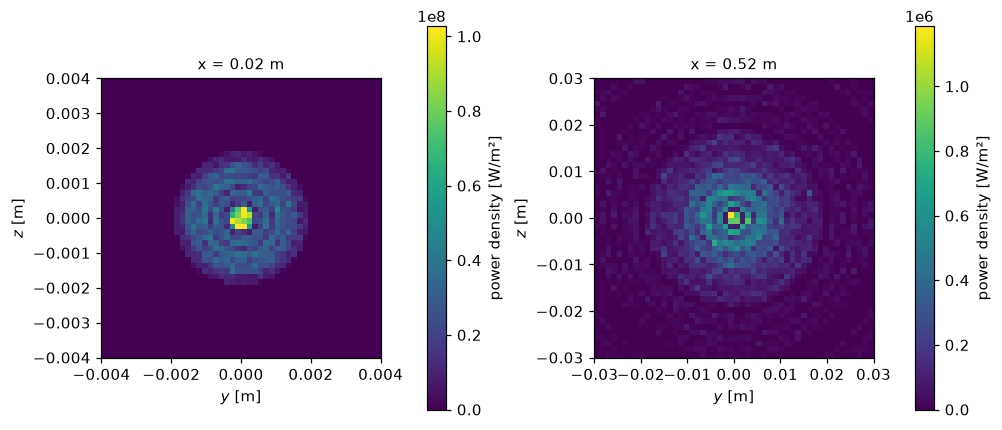
A group of apertures
Section titled “A group of apertures”One beamlet group of ITER’s grid has 5 by 16 apertures, 20 mm apart in and 22 mm in . Flat, every beamlet keeps its own axis and the beam is the group’s size plus a beamlet’s; curved, the grid aims the beamlets at a point on the axis, where the beam shrinks to one beamlet.
The coarse beamlet above diverges by 27 mrad (the tutorial’s optimum is not much better):
over 7 m it spreads far more than the group is wide, and the aim would not show. So the
group is made of a Gaussian beamlet of 5 mrad, ITER’s requirement, here; any Markers
serve as the beamlet. The group is curved to 7 m in both directions, and the footprints
are drawn at 0, 3.5 and 7 m.
narrow = gaussian_beam( 4000, power=beamlet.total_power, speed=np.mean(beamlet.velocity[0]), width=2e-3, divergence=5e-3, state="-",)flat = ApertureGrid.regular(16, 5, (0.020, 0.022))curved = ApertureGrid.regular(16, 5, (0.020, 0.022), focal_length=(7.0, 7.0))beams = {"flat": flat.markers(narrow), "curved to 7 m": curved.markers(narrow)}distances = (0.0, 3.5, 7.0)with pp.figure(2, 3, figsize=(11, 8)) as fig: for row, (label, beam) in enumerate(beams.items()): for col, x in enumerate(distances): beam.drift_to(x).footprint( bins=150, extent=(-0.3, 0.3, -0.3, 0.3) ).plasma.plot.slice( x="y", y="z", equal_aspect=True, ax=fig[3 * row + col], title=f"{label}, x = {x} m", colorbar_label="W/m²", )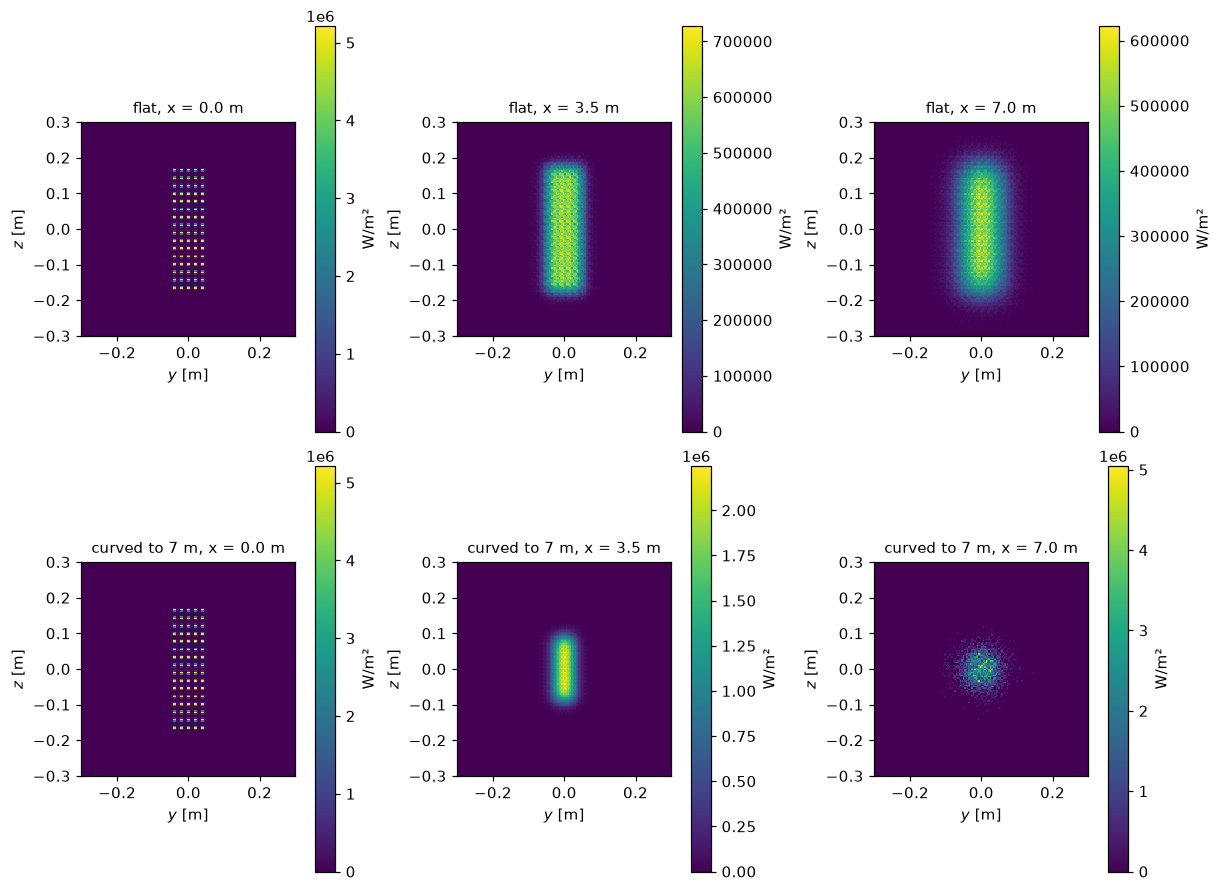
The width of the beam along
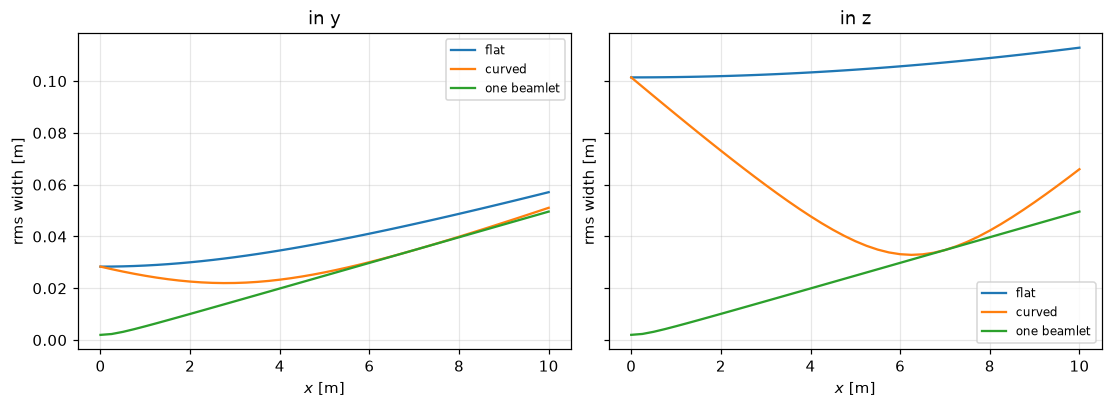
Section titled “The width of the beam along xxx”The rms width (power-weighted, about the axis) of the whole beam in and against the distance. Flat, it grows from the group’s size; curved, it meets that of one beamlet at the focus, where every beamlet’s axis crosses the axis, and follows it beyond. Its minimum lies before the focus, as the beamlets spread while they converge.
xs = np.linspace(0.0, 10.0, 41)

def widths(beam):    w = np.array(        [            np.sqrt(                np.average(                    beam.drift_to(x).position[1:] ** 2, axis=1, weights=beam.power                )            )            for x in xs        ]    )    return xr.DataArray(        w.T,        dims=("direction", "x"),        coords={"direction": ["y", "z"], "x": ("x", xs, {"units": "m"})},        name="width",        attrs={"units": "m", "long_name": "rms width"},    )

single = widths(narrow)with pp.figure(1, 2, figsize=(10, 3.6), sharey=True) as fig:    for k, direction in enumerate(("y", "z")):        for beam in beams.values():            widths(beam).plasma.plot.lineout(x="x", direction=k, ax=fig[k])        single.plasma.plot.lineout(x="x", direction=k, ax=fig[k])        fig[k].legend(["flat", "curved", "one beamlet"], fontsize=8)        fig[k].set_title(f"in {direction}")