A first patch hierarchy
A hierarchy is a coarse base mesh and rectangular patches of finer cells on top of it. This tutorial builds one, shows the rules the patches follow, and puts fields on it.
import numpy as np
from patchwork import AMRHierarchy, plot_patches
The base level
Section titled “The base level”base_shape is the number of cells along each axis and bounds the physical rectangle they
cover. Every level is twice as fine as the one below (refinement_ratio).
mesh = AMRHierarchy(base_shape=(16, 12), bounds=((0.0, 2.0), (0.0, 1.5)))
print("cell size on level 0:", mesh.spacing(0))print("cell size on level 1:", mesh.spacing(1))print("cells over the whole domain on level 1:", mesh.level_shape(1))
cell size on level 0: (0.125, 0.125)cell size on level 1: (0.0625, 0.0625)cells over the whole domain on level 1: (32, 24)Patches
Section titled “Patches”A patch is a box of cells on its own level, written as half-open index ranges
((i_lower, i_upper), (j_lower, j_upper)). The level-1 box ((8, 24), (6, 18)) covers
base cells 4 to 12 along x and 3 to 9 along y.
middle = mesh.add_patch(level=1, box=((8, 24), (6, 18)))corner = mesh.add_patch(level=2, box=((20, 36), (16, 32)))
for patch in mesh:    print(        f"level {patch.level}: cells {patch.box}, {patch.shape} of them, "        f"x and y ranges {patch.physical_bounds(mesh)}"    )
level 0: cells ((0, 16), (0, 12)), (16, 12) of them, x and y ranges ((0.0, 2.0), (0.0, 1.5))level 1: cells ((8, 24), (6, 18)), (16, 12) of them, x and y ranges ((0.5, 1.5), (0.375, 1.125))level 2: cells ((20, 36), (16, 32)), (16, 16) of them, x and y ranges ((0.625, 1.125), (0.5, 1.0))fig, ax = plot_patches(mesh)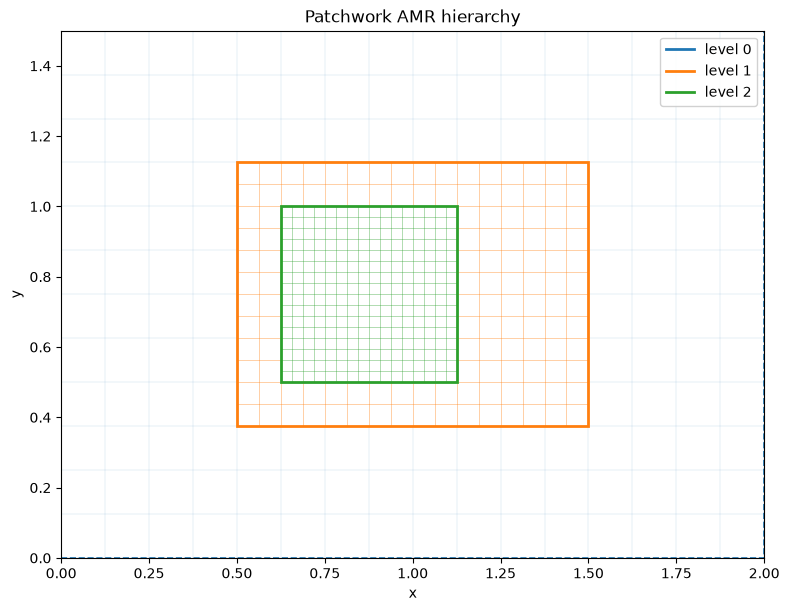
The rules
Section titled “The rules”Three rules keep the hierarchy consistent, and add_patch refuses a patch that breaks one:
- its bounds fall on cell edges of the level below (even indices for a refinement ratio of two);
- it lies inside the patches of the level below;
- it does not overlap another patch of its level.
for level, box in ( (1, ((7, 15), (6, 10))), # starts in the middle of a base cell (2, ((4, 12), (4, 12))), # no level-1 patch underneath (1, ((20, 28), (6, 10))), # overlaps the level-1 patch): try: mesh.add_patch(level=level, box=box) except ValueError as error: print(f"refused {box}: {error}")refused ((7, 15), (6, 10)): level-1 patch bounds must align to level-0 cellsrefused ((4, 12), (4, 12)): patch ((4, 12), (4, 12)) is not contained in the level-1 patchesrefused ((20, 28), (6, 10)): patch ((20, 28), (6, 10)) overlaps an existing level-1 patchFields
Section titled “Fields”allocate_field puts an array on every patch, of patches added before and after the call.
A cell-centered field has one value per cell; a node-centered one has one per cell corner,
one more along each axis. Each array is an
mpiarray array: local is this rank’s part of the
patch, local_with_halos the same with the halo cells around it.
mesh.allocate_field("density")mesh.allocate_field("potential", centering="node", halo=1)
for patch in mesh:    print(        f"level {patch.level}: density {patch.field('density').local.shape}, "        f"potential {patch.field('potential').local.shape}, "        f"with halo {patch.field('potential').local_with_halos.shape}"    )
level 0: density (16, 12), potential (17, 13), with halo (19, 15)level 1: density (16, 12), potential (17, 13), with halo (19, 15)level 2: density (16, 16), potential (17, 17), with halo (19, 19)local_cell_centers gives the coordinates of the cells to fill a field with, and
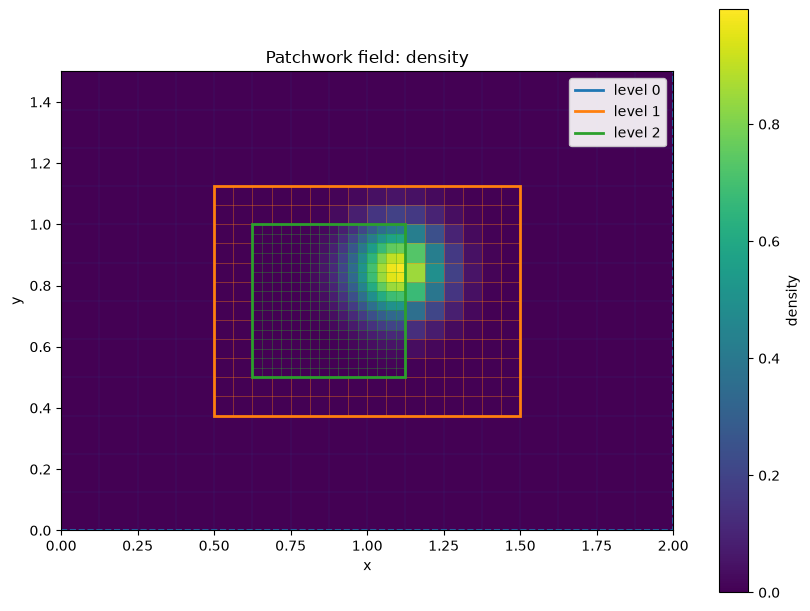
plot_patches draws a field on all patches with one colour scale, the finest patch on top.
for patch in mesh:    x, y = patch.local_cell_centers(mesh)    patch.field("density").local[...] = np.exp(        -((x - 1.1) ** 2 + (y - 0.85) ** 2) / 0.02    )
fig, ax = plot_patches(mesh, field="density")