Vector field streamlines
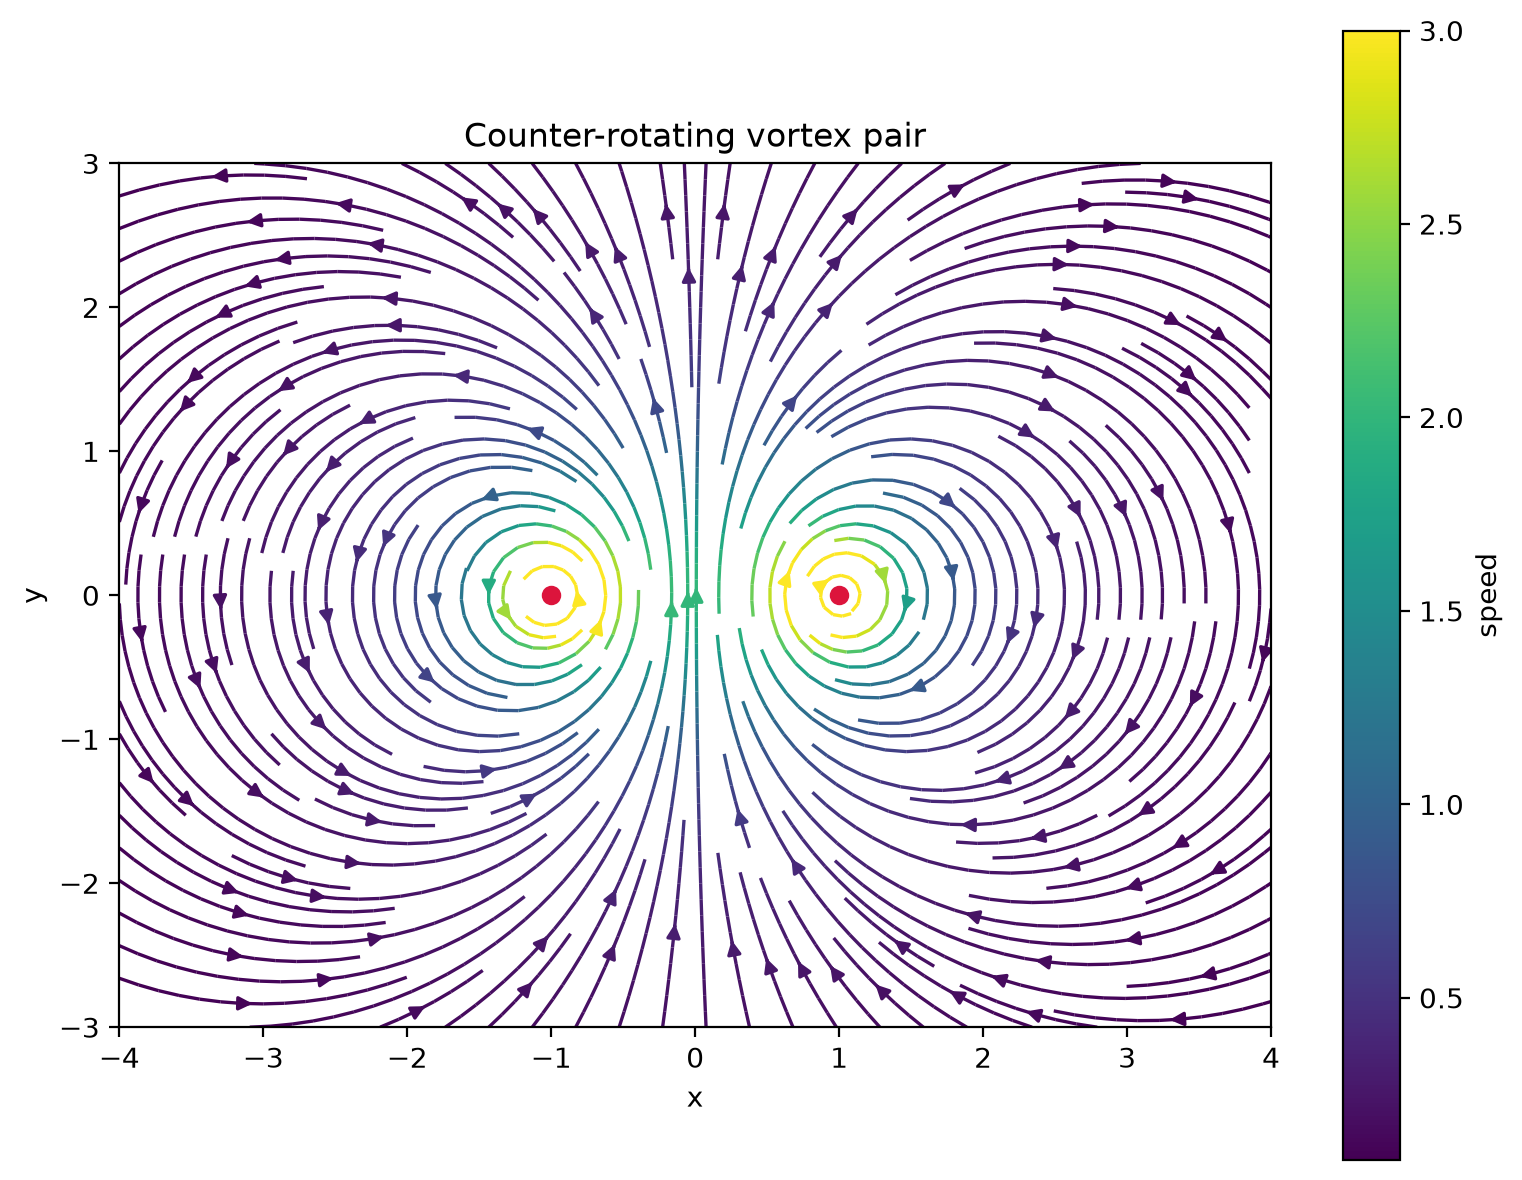
Streamlines of the flow around a vortex pair, coloured by speed.
A counter-rotating vortex pair of circulation at induces the velocity
This example uses matplotlib, so the page shows a PNG.
Source code
Section titled “Source code”import matplotlib.pyplot as pltimport numpy as np
gamma, a = 2.0 * np.pi, 1.0x, y = np.meshgrid(np.linspace(-4.0, 4.0, 200), np.linspace(-3.0, 3.0, 150))
u = np.zeros_like(x)v = np.zeros_like(x)for sign, x0 in [(+1.0, -a), (-1.0, a)]: dx, dy = x - x0, y r2 = np.maximum(dx**2 + dy**2, 1e-3) u += sign * gamma / (2.0 * np.pi) * (-dy) / r2 v += sign * gamma / (2.0 * np.pi) * dx / r2
speed = np.hypot(u, v)fig, ax = plt.subplots(figsize=(8, 6))lines = ax.streamplot( x, y, u, v, color=np.minimum(speed, 3.0), cmap="viridis", density=1.8, linewidth=1.2)fig.colorbar(lines.lines, ax=ax, label="speed")ax.plot([-a, a], [0, 0], "o", color="crimson")ax.set(xlabel="x", ylabel="y", title="Counter-rotating vortex pair", aspect="equal")fig.tight_layout()plt.show()