Damped oscillator
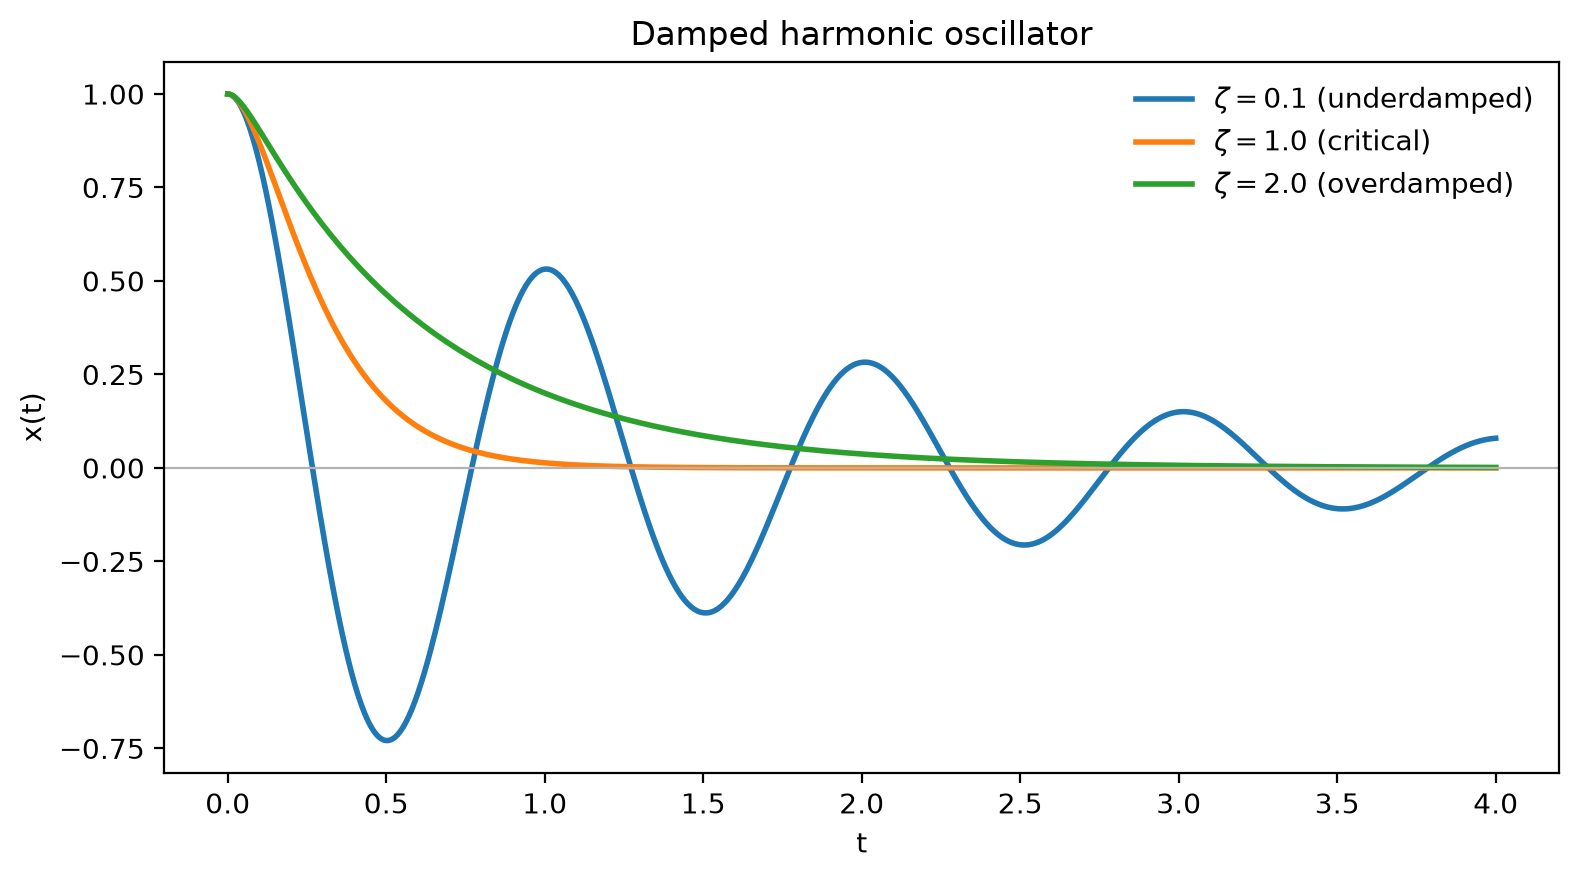
Underdamped, critically damped and overdamped motion of a mass on a spring.
The displacement obeys . The damping ratio decides between the three regimes. This example is a matplotlib figure, so the page shows a PNG, and the script prints the decay rate of the underdamped case.
Source code
Section titled “Source code”import matplotlib.pyplot as pltimport numpy as np
omega0 = 2.0 * np.pit = np.linspace(0.0, 4.0, 800)
def displacement(zeta: float) -> np.ndarray: """x(t) for x(0) = 1, x'(0) = 0.""" if zeta < 1.0: wd = omega0 * np.sqrt(1.0 - zeta**2) return np.exp(-zeta * omega0 * t) * ( np.cos(wd * t) + zeta * omega0 / wd * np.sin(wd * t) ) if zeta == 1.0: return np.exp(-omega0 * t) * (1.0 + omega0 * t) root = omega0 * np.sqrt(zeta**2 - 1.0) a, b = -zeta * omega0 + root, -zeta * omega0 - root return (b * np.exp(a * t) - a * np.exp(b * t)) / (b - a)
fig, ax = plt.subplots(figsize=(8, 4.5))for zeta, label in [(0.1, "underdamped"), (1.0, "critical"), (2.0, "overdamped")]: ax.plot(t, displacement(zeta), lw=2, label=f"$\\zeta = {zeta}$ ({label})")ax.axhline(0.0, color="0.7", lw=0.8)ax.set(xlabel="t", ylabel="x(t)", title="Damped harmonic oscillator")ax.legend(frameon=False)fig.tight_layout()
print(f"Envelope decay rate of the underdamped case: {0.1 * omega0:.3f} per unit time")plt.show()Printed output
Envelope decay rate of the underdamped case: 0.628 per unit time