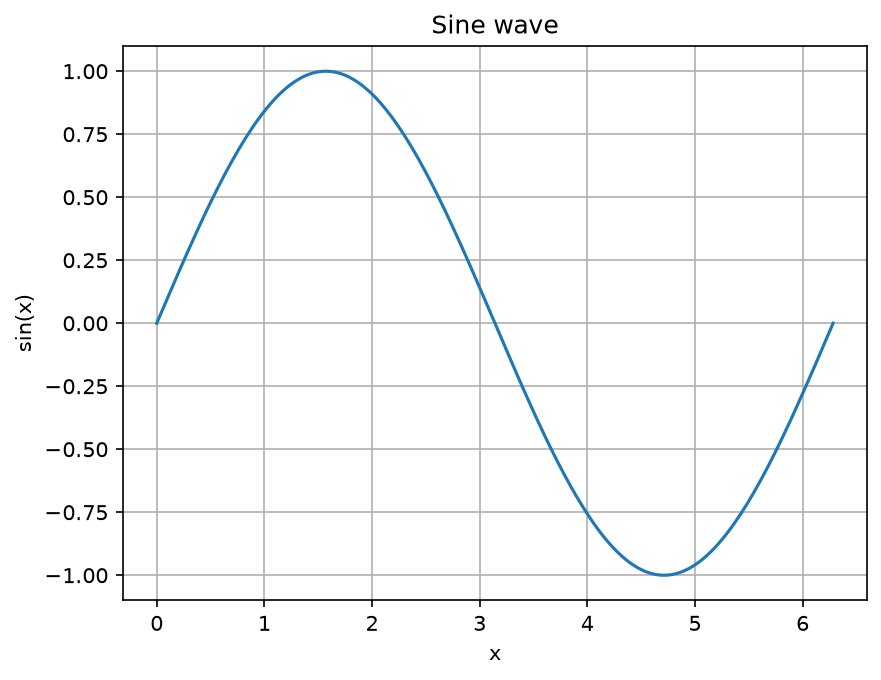
Plot a sine wave.
Create a simple line plot with NumPy and Matplotlib. The finished figure appears below the complete Python source in the documentation.
Python source
Section titled “Python source”"""Plot a sine wave.
Create a simple line plot with NumPy and Matplotlib. The finished figure appears below thecomplete Python source in the documentation."""
import matplotlib.pyplot as pltimport numpy as np
x = np.linspace(0, 2 * np.pi, 200)y = np.sin(x)
fig, ax = plt.subplots()ax.plot(x, y)ax.set(xlabel="x", ylabel="sin(x)", title="Sine wave")ax.grid(True)