Tutorial 3
[1]:
%load_ext autoreload
%autoreload 2
[2]:
from tikzpics import TikzFigure
[3]:
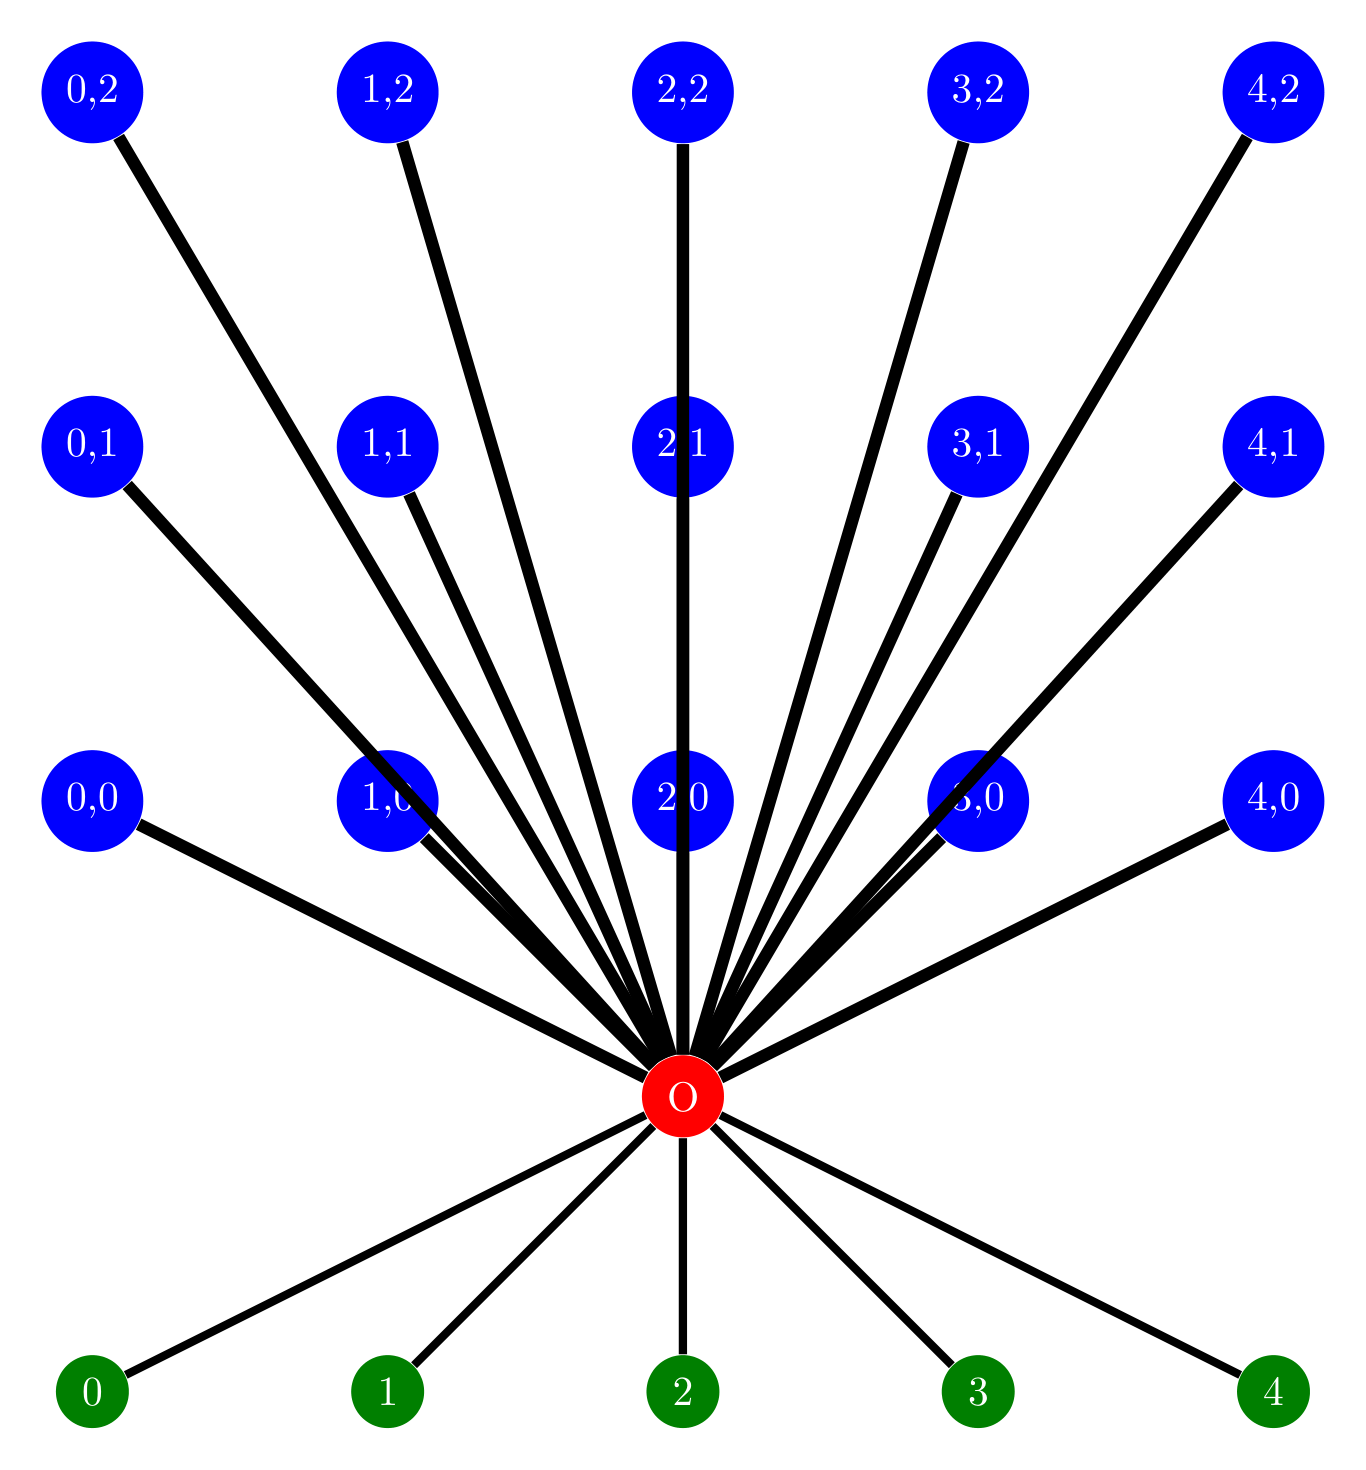
fig = TikzFigure()

num_xpoints = 5
num_ypoints = 3
dx = 2.5

origin = fig.add_node(
    ((num_xpoints - 1) / 2) * dx,
    -2.5,
    label="origin",
    content=r"\color{white}O",
    shape="circle",
    fill="red",
    comment="Origin node",
)

# Green nodes at the bottom
with fig.add_loop("i", range(num_xpoints), comment="Green nodes at the bottom") as loop:
    node = loop.add_node(
        f"{dx}*\\i",
        -5.0,
        label=r"xnodes\i",
        content=r"\color{white}\i",
        shape="circle",
        fill="green!50!black",
    )

# Draw lines from origin to the bottom nodes
with fig.add_loop(
    "i", range(num_xpoints), comment="Lines from origin to green nodes"
) as loop:
    loop.add_path(
        [origin, node],
        color="black",
        options=["line width=2"],
    )

# Draw the top node grid
with fig.add_loop("i", range(num_xpoints), comment="Blue nodegrid") as loop_i:
    with loop_i.add_loop("j", range(num_ypoints), comment="inner j-loop") as loop_j:
        node = loop_j.add_node(
            f"{dx}*\\i",
            r"3*\j",
            label=r"xynodes\i\j",
            content=r"\color{white}\i,\j",
            shape="circle",
            fill="blue",
        )

# Lines from origin to blue node grid
with fig.add_loop(
    "i", range(num_xpoints), comment="Lines from origin to blue node grid"
) as loop_i:
    with loop_i.add_loop("j", range(num_ypoints), comment="inner j-loop") as loop_j:
        loop_j.add_path(
            [origin, node],
            color="black",
            options=["line width=3"],
        )


fig.show()
[4]:
print(fig.generate_standalone())
\documentclass[border=10pt]{standalone}
\usepackage{tikz}
\usepackage{pgfplots}
\pgfplotsset{compat=newest}
\usetikzlibrary{arrows.meta}
\begin{document}
% --------------------------------------------- %
% Tikzfigure generated by tikzpics v0.1         %
% https://github.com/max-models/tikzpics        %
% --------------------------------------------- %
\begin{tikzpicture}

    % Define the layers library
    \pgfdeclarelayer{0}
    \pgfsetlayers{0}

    % Layer 0
    \begin{pgfonlayer}{0}

        % Origin node
        \node[shape=circle, fill=red] (origin) at (5.0, -2.5) {\color{white}O};

        % Green nodes at the bottom
        \foreach \i in {0,1,2,3,4}{% start \foreach
            \node[shape=circle, fill=green!50!black] (xnodes\i) at (2.5*\i, -5.0) {\color{white}\i};
        }% end \foreach

        % Lines from origin to green nodes
        \foreach \i in {0,1,2,3,4}{% start \foreach
            \draw[line width=2, color=black] (origin) to (xnodes\i);
        }% end \foreach

        % Blue nodegrid
        \foreach \i in {0,1,2,3,4}{% start \foreach

            % inner j-loop
            \foreach \j in {0,1,2}{% start \foreach
                \node[shape=circle, fill=blue] (xynodes\i\j) at (2.5*\i, 3*\j) {\color{white}\i,\j};
            }% end \foreach
        }% end \foreach

        % Lines from origin to blue node grid
        \foreach \i in {0,1,2,3,4}{% start \foreach

            % inner j-loop
            \foreach \j in {0,1,2}{% start \foreach
                \draw[line width=3, color=black] (origin) to (xynodes\i\j);
            }% end \foreach
        }% end \foreach
    \end{pgfonlayer}{0}
\end{tikzpicture}

\end{document}