First steps
A notebook that exercises what the converter handles: math, printed output, an image, an HTML table and the cell tags.
The grid spacing is , and the midpoint rule reads
Braces {like these} and a stray < are escaped for MDX.
import numpy as npfrom example_pkg import Grid, linspace_midpoints
grid = Grid(0.0, np.pi, 8)print(grid.spacing)print(grid.spacing * np.sin(linspace_midpoints(0.0, np.pi, 8)).sum())0.392699081698724142.012909085599128Show code
import matplotlib.pyplot as plt
x = grid.nodes()fig, ax = plt.subplots(figsize=(5, 2.5))ax.plot(x, np.sin(x), 'o-')ax.set_xlabel('x')plt.show()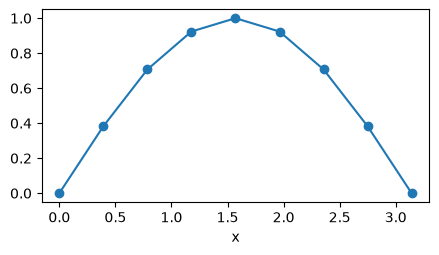
from IPython.display import HTML
HTML('<table><tr><th>cells</th><th>spacing</th></tr>' + ''.join(f'<tr><td>{n}</td><td>{np.pi / n:.4f}</td></tr>' for n in (4, 8, 16)) + '</table>')| cells | spacing |
|---|---|
| 4 | 0.7854 |
| 8 | 0.3927 |
| 16 | 0.1963 |
raise ValueError('shown on the page, and not a failure: the cell is tagged raises-exception')---------------------------------------------------------------------------ValueError Traceback (most recent call last)Cell In[4], line 1----> 1 raise ValueError('shown on the page, and not a failure: the cell is tagged raises-exception')
ValueError: shown on the page, and not a failure: the cell is tagged raises-exception