Tutorial 6 - Raw TikZ Code#
This tutorial demonstrates how to add raw TikZ code in a TikzFigure using the add_raw() method. This is useful when you need fine-grained control over TikZ commands or want to use features not directly supported by tikzpics.
[1]:
%load_ext autoreload
%autoreload 2
[2]:
from tikzpics import TikzFigure
Setup#
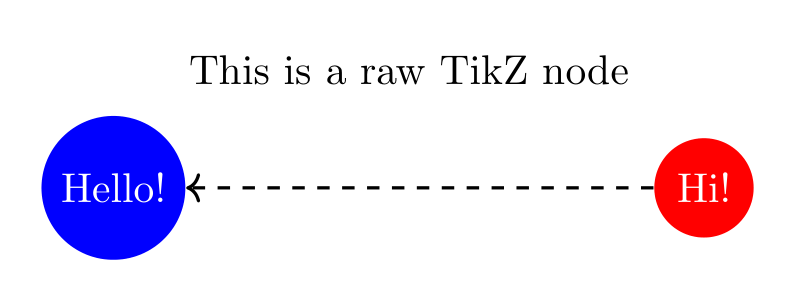
Example 1: Basic Raw TikZ#
[3]:
fig = TikzFigure()

n1 = fig.add_node(0, 0, shape="circle", color="white", fill="blue", content="Hello!")
n2 = fig.add_node(5, 0, shape="circle", color="white", fill="red", content="Hi!")

fig.add_raw("% This is a comment in the TikZ code")
fig.add_raw("\\node at (2.5, 1) {This is a raw TikZ node};")
fig.add_raw(f"\\draw[->, thick, dashed, in=30] ({n2.label}) -- ({n1.label});")

fig.show()
print(fig.generate_tikz())
% --------------------------------------------- %
% Tikzfigure generated by tikzpics v0.1.3       %
% https://github.com/max-models/tikzpics        %
% --------------------------------------------- %
\begin{tikzpicture}
    \node[shape=circle, color=white, fill=blue] (node0) at (0, 0) {Hello!};
    \node[shape=circle, color=white, fill=red] (node1) at (5, 0) {Hi!};
    % This is a comment in the TikZ code
    \node at (2.5, 1) {This is a raw TikZ node};
    \draw[->, thick, dashed, in=30] (node1) -- (node0);
\end{tikzpicture}
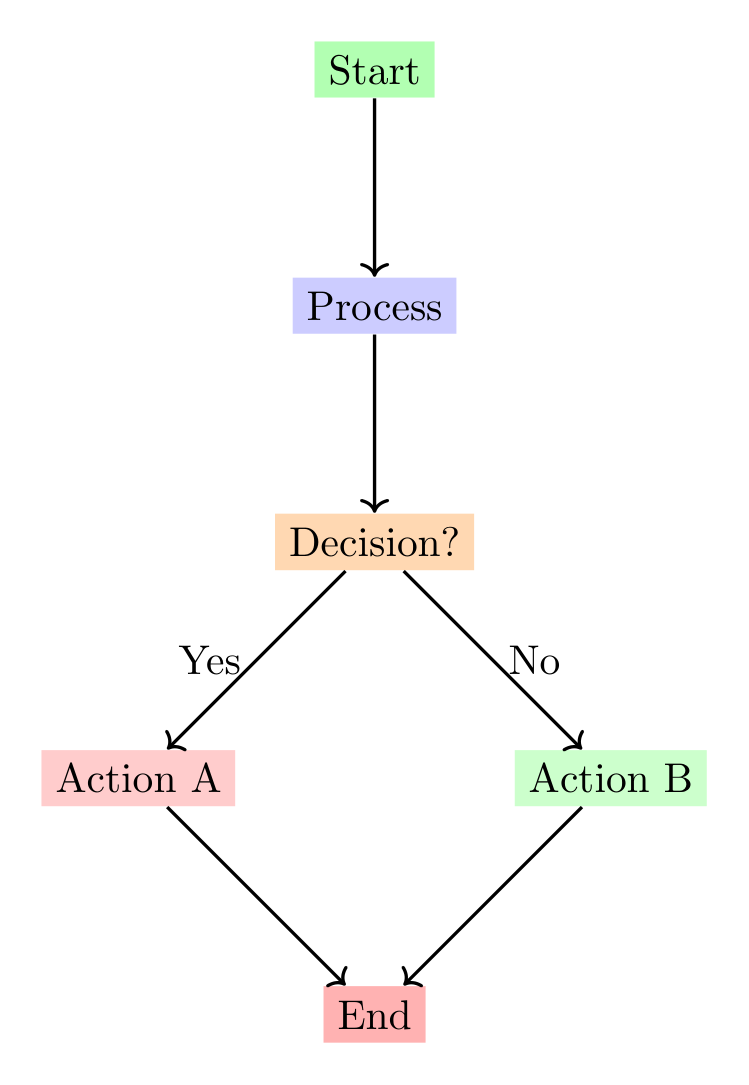
Example 2: Creating a Flowchart with Decision Nodes#
[4]:
fig = TikzFigure()

# Create flowchart nodes
start = fig.add_node(2, 4, shape="ellipse", fill="green!30", content="Start")
process = fig.add_node(2, 2, shape="rectangle", fill="blue!20", content="Process")
decision = fig.add_node(2, 0, shape="diamond", fill="orange!30", content="Decision?")

# Create outcome nodes
yes_node = fig.add_node(0, -2, shape="rectangle", fill="red!20", content="Action A")
no_node = fig.add_node(4, -2, shape="rectangle", fill="green!20", content="Action B")
end = fig.add_node(2, -4, shape="ellipse", fill="red!30", content="End")

# Use raw TikZ to create custom arrows with labels
fig.add_raw(f"\\draw[->, thick] ({start.label}) -- ({process.label});")
fig.add_raw(f"\\draw[->, thick] ({process.label}) -- ({decision.label});")
fig.add_raw(
    f"\\draw[->, thick] ({decision.label}) -- node[left] {{Yes}} ({yes_node.label});"
)
fig.add_raw(
    f"\\draw[->, thick] ({decision.label}) -- node[right] {{No}} ({no_node.label});"
)
fig.add_raw(f"\\draw[->, thick] ({yes_node.label}) -- ({end.label});")
fig.add_raw(f"\\draw[->, thick] ({no_node.label}) -- ({end.label});")

fig.show()
An error occurred while compiling the LaTeX document:
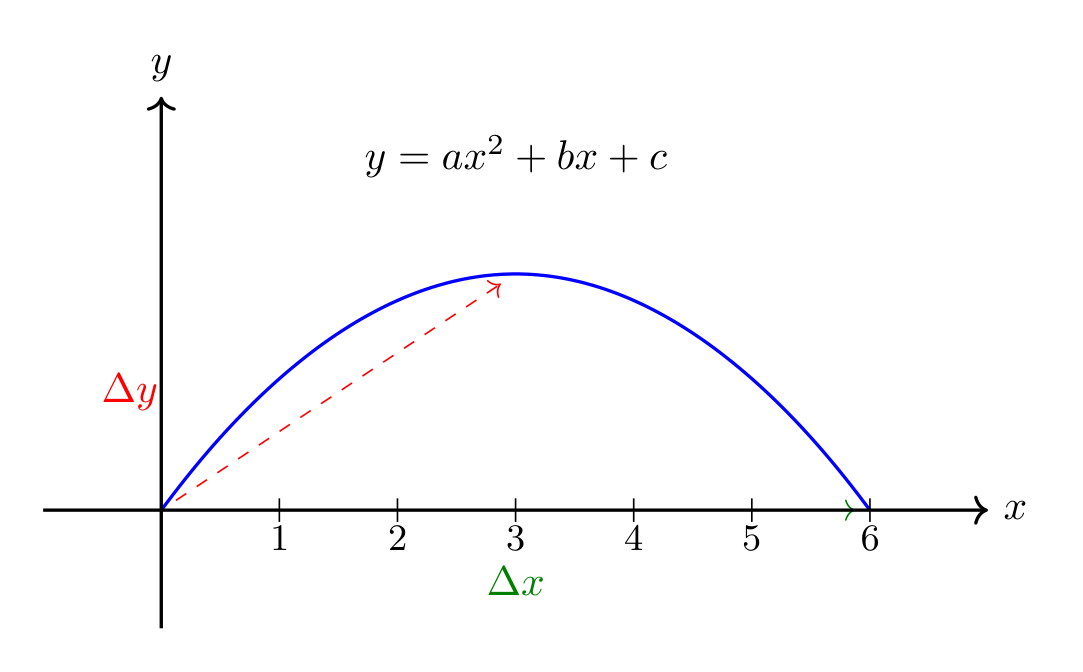
Example 3: Mathematical Annotations and Custom Paths#
[5]:
fig = TikzFigure()

# Create coordinate points
p1 = fig.add_node(0, 0, content="")
p2 = fig.add_node(3, 2, content="")
p3 = fig.add_node(6, 0, content="")

# Use raw TikZ to draw a parabola with mathematical annotations
fig.add_raw(
    f"\\draw[thick, blue] ({p1.label}) parabola bend ({p2.label}) ({p3.label});"
)
fig.add_raw(
    f"\\draw[->, dashed, red] ({p1.label}) -- ({p2.label}) node[midway, left=40pt] {{$\\Delta y$}};"
)
fig.add_raw(
    f"\\draw[->, dashed, green!50!black] ({p1.label}) -- ({p3.label}) node[midway, below=10pt] {{$\\Delta x$}};"
)

# Add mathematical formula
fig.add_raw("\\node at (3, 3) {$y = ax^2 + bx + c$};")

# Draw coordinate axes with raw TikZ
fig.add_raw("\\draw[->, thick] (-1, 0) -- (7, 0) node[right] {$x$};")
fig.add_raw("\\draw[->, thick] (0, -1) -- (0, 3.5) node[above] {$y$};")

# Add tick marks
for i in range(1, 7):
    fig.add_raw(f"\\draw ({i}, -0.1) -- ({i}, 0.1) node[below=3pt] {{\\small {i}}};")

fig.show()
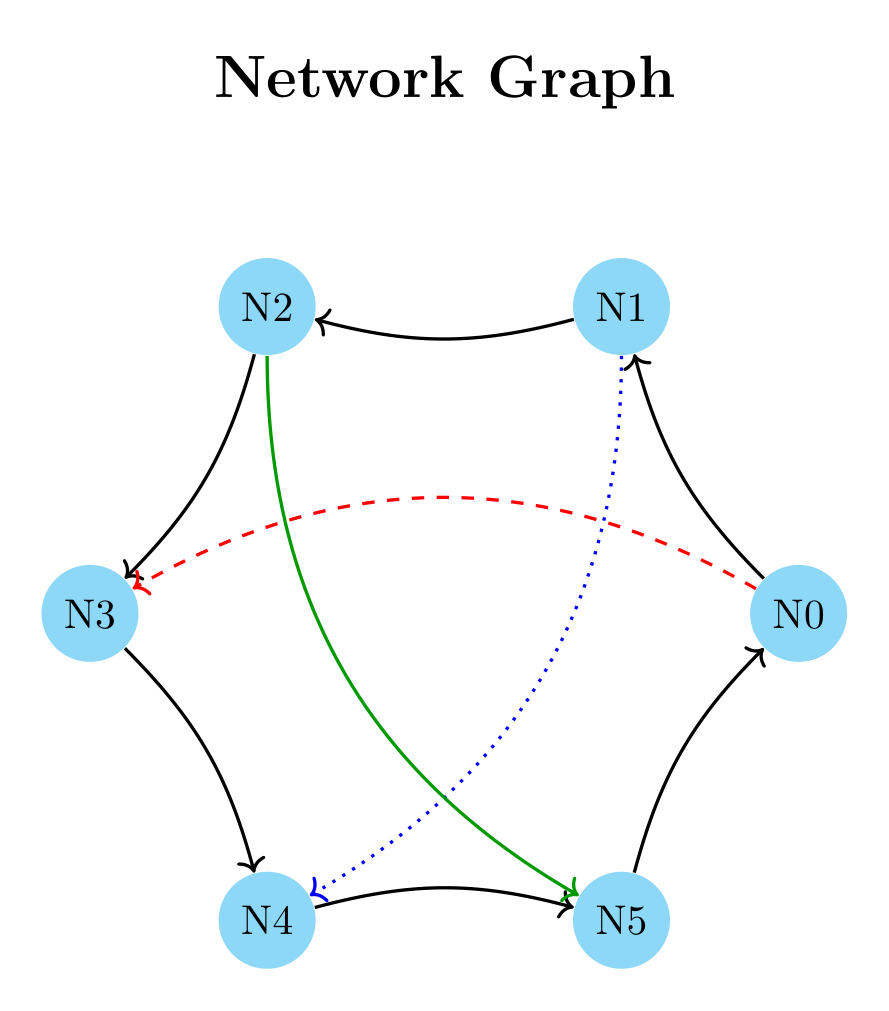
Example 4: Network Graph with Curved Edges#
[6]:
import math

fig = TikzFigure()

# Create nodes in a circular layout
n = 6
radius = 3
nodes = []

for i in range(n):
    angle = 360 / n * i
    x = radius * math.cos(math.radians(angle))
    y = radius * math.sin(math.radians(angle))
    node = fig.add_node(x, y, shape="circle", fill="cyan!40", content=f"N{i}")
    nodes.append(node)

# Connect nodes with curved edges using raw TikZ
# Create a ring connection
for i in range(n):
    next_i = (i + 1) % n
    fig.add_raw(
        f"\\draw[->, thick, bend left=15] ({nodes[i].label}) edge ({nodes[next_i].label});"
    )

# Add some cross connections with different styles
fig.add_raw(
    f"\\draw[->, red, thick, dashed, bend right=30] ({nodes[0].label}) edge ({nodes[3].label});"
)
fig.add_raw(
    f"\\draw[->, blue, thick, dotted, bend left=30] ({nodes[1].label}) edge ({nodes[4].label});"
)
fig.add_raw(
    f"\\draw[->, green!60!black, thick, bend right=30] ({nodes[2].label}) edge ({nodes[5].label});"
)

# Add a title
fig.add_raw("\\node[font=\\Large\\bfseries] at (0, 4.5) {Network Graph};")

fig.show()
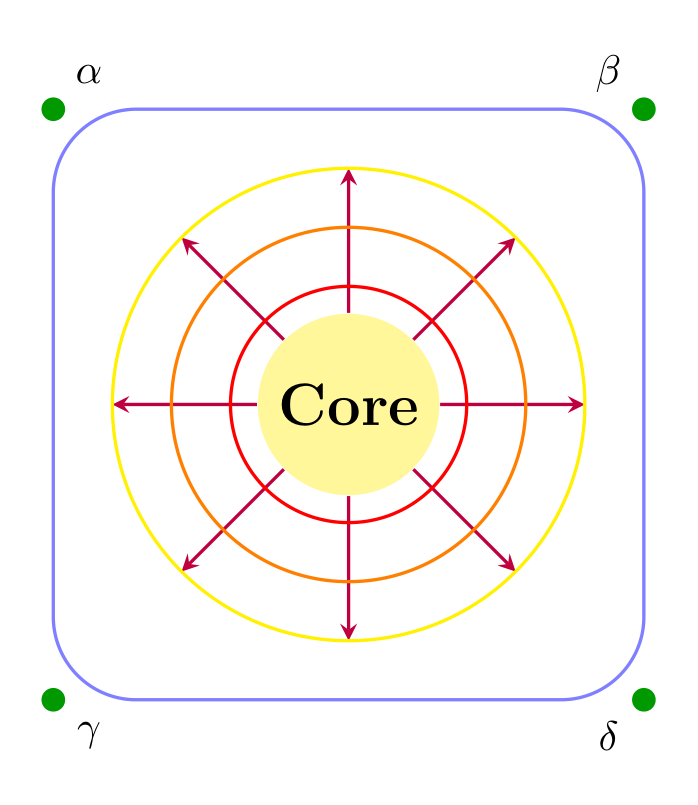
Example 5: Decorative Elements and Custom Shapes#
[7]:
fig = TikzFigure()

# Create a central node
center = fig.add_node(
    3,
    3,
    shape="circle",
    fill="yellow!50",
    content="Core",
    options=["minimum size=1.5cm", "font=\\Large\\bfseries"],
)

# Use raw TikZ to create decorative elements
# Draw a star pattern around the center
for angle in range(0, 360, 45):
    x_outer = 3 + 2 * math.cos(math.radians(angle))
    y_outer = 3 + 2 * math.sin(math.radians(angle))
    fig.add_raw(
        f"\\draw[thick, purple, -stealth] ({center.label}) -- ({x_outer}, {y_outer});"
    )

# Create a decorative border
fig.add_raw(
    "\\draw[thick, blue!50, rounded corners=20pt] (0.5, 0.5) rectangle (5.5, 5.5);"
)

# Add gradient circles using raw TikZ
fig.add_raw("\\draw[red, thick] (3, 3) circle (1cm);")
fig.add_raw("\\draw[orange, thick] (3, 3) circle (1.5cm);")
fig.add_raw("\\draw[yellow, thick] (3, 3) circle (2cm);")

# Add corner decorations
fig.add_raw("\\fill[green!60!black] (0.5, 0.5) circle (0.1);")
fig.add_raw("\\fill[green!60!black] (5.5, 0.5) circle (0.1);")
fig.add_raw("\\fill[green!60!black] (0.5, 5.5) circle (0.1);")
fig.add_raw("\\fill[green!60!black] (5.5, 5.5) circle (0.1);")

# Add mathematical symbols at corners
fig.add_raw("\\node at (0.8, 5.8) {$\\alpha$};")
fig.add_raw("\\node at (5.2, 5.8) {$\\beta$};")
fig.add_raw("\\node at (0.8, 0.2) {$\\gamma$};")
fig.add_raw("\\node at (5.2, 0.2) {$\\delta$};")

fig.show()
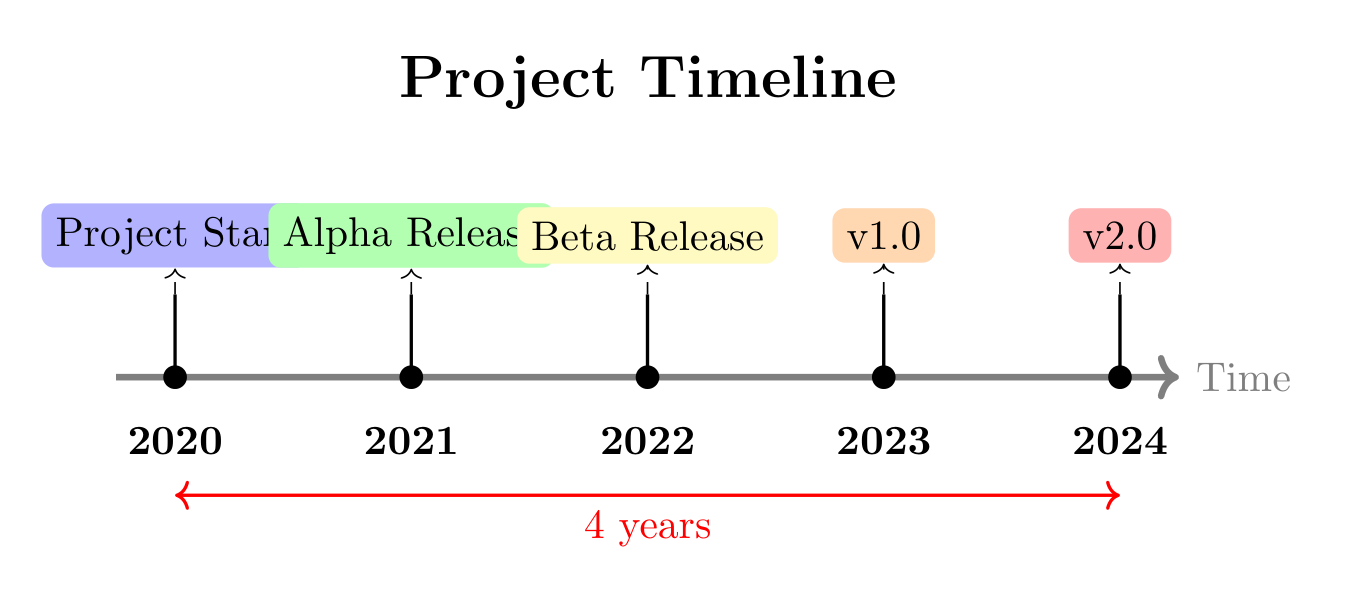
Example 6: Timeline Visualization#
[8]:
fig = TikzFigure()

# Timeline data
events = [
    (0, "2020", "Project Start", "blue!30"),
    (2, "2021", "Alpha Release", "green!30"),
    (4, "2022", "Beta Release", "yellow!30"),
    (6, "2023", "v1.0", "orange!30"),
    (8, "2024", "v2.0", "red!30"),
]

# Draw the main timeline
fig.add_raw("\\draw[->, ultra thick, gray] (-0.5, 0) -- (8.5, 0) node[right] {Time};")

# Add events
for x, year, label, color in events:
    # Create event node above timeline
    event_node = fig.add_node(
        x,
        1.2,
        shape="rectangle",
        fill=color,
        content=label,
        options=["rounded corners=3pt"],
    )

    # Use raw TikZ to connect to timeline with custom styling
    fig.add_raw(f"\\draw[thick] ({x}, 0) -- ({x}, 0.7);")
    fig.add_raw(f"\\fill ({x}, 0) circle (0.1);")
    fig.add_raw(f"\\node[below] at ({x}, -0.3) {{\\textbf{{{year}}}}};")

    # Add connecting line
    fig.add_raw(f"\\draw[->, dashed] ({x}, 0.7) -- ({event_node.label});")

# Add milestone markers
fig.add_raw("\\node[font=\\Large\\bfseries] at (4, 2.5) {Project Timeline};")

# Add some annotations with raw TikZ
fig.add_raw("\\draw[<->, red, thick] (0, -1) -- node[below] {4 years} (8, -1);")

fig.show()